Portland Metro Area Market Report
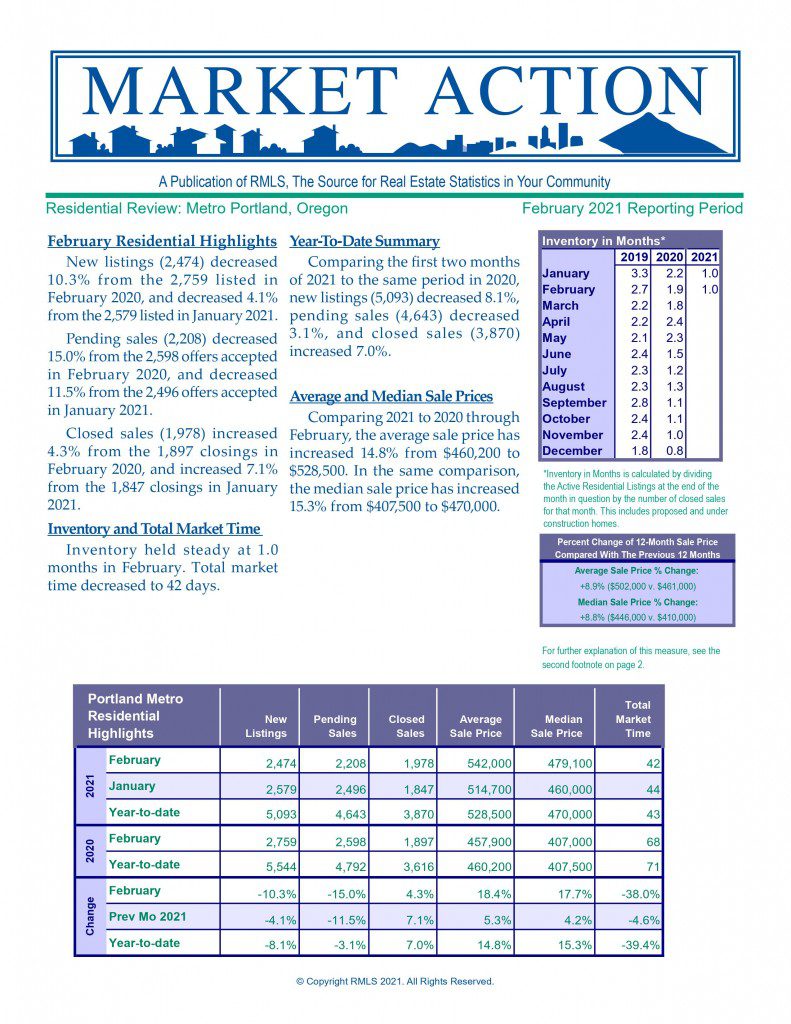
Portland Metro Market Action — February 2024

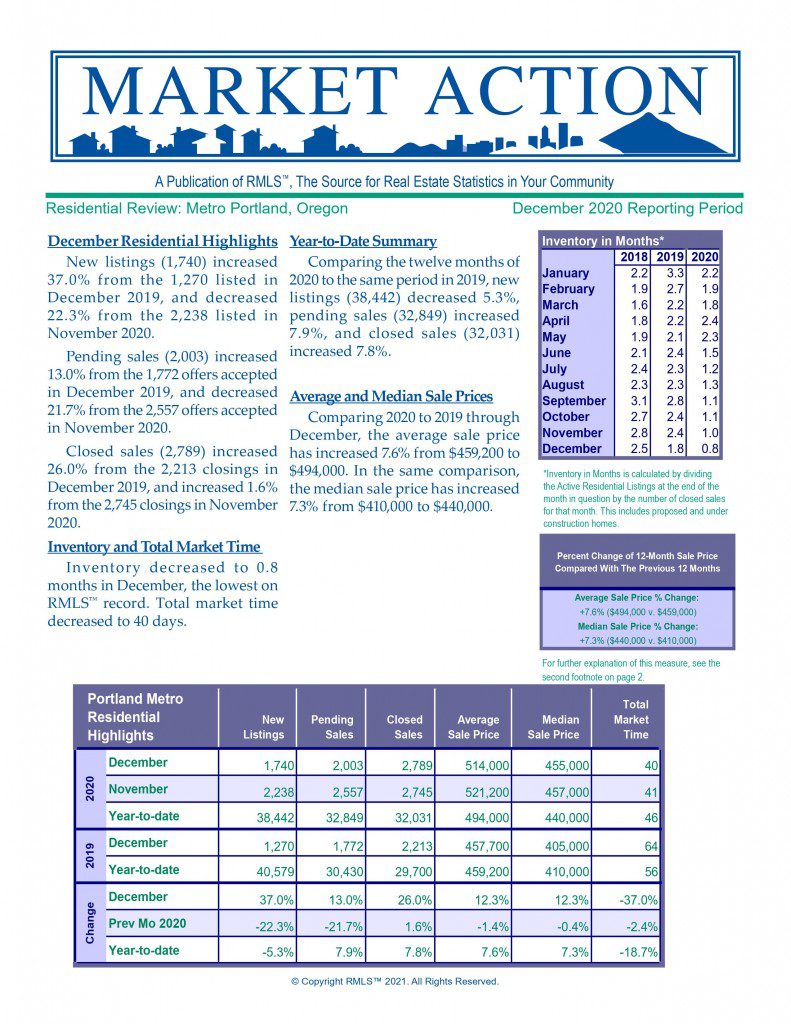
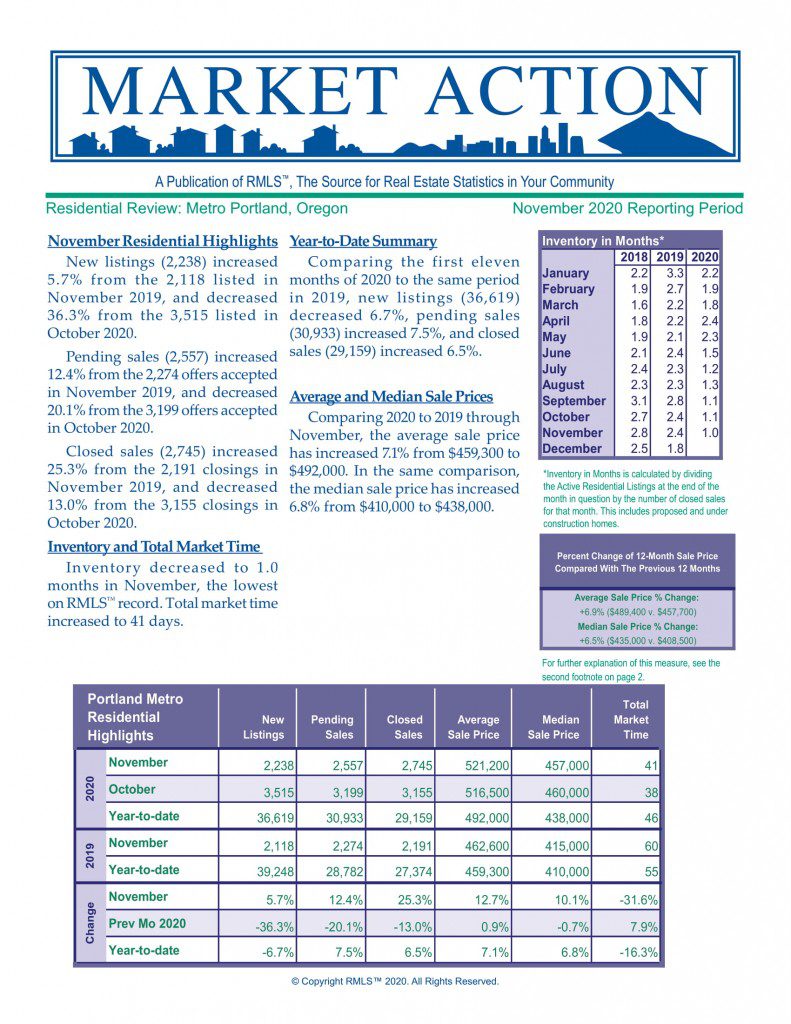
Portland Metro Market Action — November 2023

Portland, OR Inventory held steady at 0.7 months in May. Total market time decreased to 22 days. #BetterCallJamohl 503.545.4945


Pending sales (3,654) increased 18.5% from the 3,083 offers accepted in June 2019, and increased 17.4% from the 3,112 offers accepted in May 2020


Inventory held steady at 1.1 months in October, and continues to be the lowest on RMLSâ„¢ record. Total market time held steady at 38 days.


Pending sales (3,654) increased 18.5% from the 3,083 offers accepted in June 2019, and increased 17.4% from the 3,112 offers accepted in May 2020


Pending sales (3,654) increased 18.5% from the 3,083 offers accepted in June 2019, and increased 17.4% from the 3,112 offers accepted in May 2020


Inventory decreased to 1.1 months in September. Total market time decreased to 38 days


Pending sales (3,654) increased 18.5% from the 3,083 offers accepted in June 2019, and increased 17.4% from the 3,112 offers accepted in May 2020


Inventory increased to 1.3 months in August. Total market time decreased to 41 days.


Pending sales (3,654) increased 18.5% from the 3,083 offers accepted in June 2019, and increased 17.4% from the 3,112 offers accepted in May 2020


Inventory decreased to 1.2 months in July. Total market time held steady at 42 days


Pending sales (3,654) increased 18.5% from the 3,083 offers accepted in June 2019, and increased 17.4% from the 3,112 offers accepted in May 2020


Pending sales (3,654) increased 18.5% from the 3,083 offers accepted in June 2019, and increased 17.4% from the 3,112 offers accepted in May 2020


Pending sales (3,654) increased 18.5% from the 3,083 offers accepted in June 2019, and increased 17.4% from the 3,112 offers accepted in May 2020


Pending sales (3,654) increased 18.5% from the 3,083 offers accepted in June 2019, and increased 17.4% from the 3,112 offers accepted in May 2020


Inventory decreased to 2.3 months in May. Total market time decreased to 38 days.


Inventory decreased to 1.8 months this December, while total market time increased to 64 days


Comparing the first three months of 2020 to the same period in 2019, new listings (9,041) have held steady, pending sales (6,935) increased 1.1%, and closed sales (6,048) have increased 10.5%.


Inventory decreased to 1.8 months this December, while total market time increased to 64 days


Inventory decreased to 1.8 months this December, while total market time increased to 64 days


Inventory decreased to 1.8 months this December, while total market time increased to 64 days


Inventory decreased to 1.8 months this December, while total market time increased to 64 days


Comparing the first two months of 2020 to the same period in 2019, new listings (5,544) have held steady 0.6%, pending sales (4,792) increased 14.2%, and closed sales (3,616) have increased 12.1%.


Inventory decreased to 1.8 months this December, while total market time increased to 64 days


This year new listings (2,754) have decreased 9.6%, pending sales (2,271) have increased 11.1% and closed sales (1,663) have increased 14.6%.


Inventory decreased to 1.8 months this December, while total market time increased to 64 days


Inventory stayed at 2.4 months this November, while total market time increased to 60 days.


Activity is a bit cooler so far in 2019 compared with 2018. Pending sales (26,599) are up 0.4%, new listings (37,091) are down 1.4%, and closed sales (25,085) are down 1.8%


Activity is a bit cooler so far in 2019 compared with 2018. Pending sales (24,126) are down 0.1%, new listings (33,981) are down 1.3%, and closed sales (22,398) are down 2.5%.


This was the strongest July for closings in the area since 2015, when 3,452 closings were recorded.


Activity is mixed so far in 2019 compared with 2018. Inventory rose slightly to 2.4 months in June. Total market time decreased to 42 days in the same period.


There were 2,969 closed sales, a 5.9% increase over May 2018 (2,803) and a 23.2% increase over April 2019 (2,409). This was the strongest May for closings in the area since 2006


Inventory decreased to 2.2 months in March, with total market time decreasing to 68 days.


Total market time decreased by one day in February to end at 75 days. During the same period, inventory decreased to 2.7 months.


Wow. The prior January (2019) that had more listings was in 2011, when 3,128 were offered.


Closed sales saw an upswing this April in the Portland metro area. There were 2,523 closings, a 13.7% increase over April 2017 (2,219) and a 6.4% increase over last month in March 2018 (2,371).

